GroenLinks also emerges as the winner of the municipal elections among Uithof voters

With 20.8 per cent of the votes, Groenlinks has received the most votes in the Utrecht Science Park, according to the results issued by the municipality. However, compared to the previous municipal elections, held in 2018, the party underwent a significant reduction. GroenLinks got 10 percent fewer votes at De Uithof this time.
Student party Student & Starter came second with 19.8 percent of the votes. UU Sociology student Annemarijn Oudejans will take a seat on the city council on behalf of the party. D66 has also suffered a significant loss compared to 2018, with a decrease of 12 percent, which led to the party dropping to third place, with 13.2 per cent of the votes.
The most significant victory at the Utrecht Science Park was achieved by newcomer Volt: the party got 9.6 per cent of the votes. The other newcomer, BIJ1, also did well with the Uithof voters.
| UU 2022 polling station | UU 2018 polling station | |
| GroenLinks | 20.8% | 30.9% |
| Student & Starter | 19.8% | 16.8% |
| D66 | 13.2% | 25.2% |
| Volt | 9.6% | -** |
| Partij voor de Dieren | 6.8% | 5.2% |
| BIJ1 | 6.6% | -** |
| PvdA | 5.4% | 2.9% |
| CDA | 4.6% | 2.2% |
| ChristenUnie | 3.4% | 3.1% |
| VVD | 3.0% | 7.2% |
| EenUtrecht | 2.0% | -** |
| Forum voor Democratie | 0.9% | -** |
| SP | 0.9%* | 1.6% |
| Socialisten Utrecht | 0.8% | -** |
| Piratenpartij | 0.8% | 1.6% |
| Stadsbelang Utrecht | 0.7% | 1.1% |
| Belang van Nederland | 0.3% | -** |
| DENK | 0.2% | 0.8% |
| PVV | 0.1% | 0.7% |
| Blanco | 0.0% | - |
* without rounding off, parties finish lower on the list
** newcomers in the municipal election
The Uithof voters were considerably less inclined to vote for VVD, Prime Minister Mark Rutte's party, than the rest of Utrecht, where the liberal party has obtained third place with 9.4 percent of the votes. Only 3 percent of the votes at the Uithof went to this party, over 4 percent less than in the previous municipal elections.
Utrecht election results
When comparing the Uithof to the Utrecht average, three parties were more popular in the Utrecht Science Park compared to the rest of the city: Student & Starter (19.8 versus 5.4 per cent), BIJ1 (6.6 versus 3.4 per cent) and Volt (9.6 versus 5.7 per cent). Apart from VVD, the rest of Utrecht seems more inclined to vote for CDA, a party that received a total of 7.1 per cent of the votes. At the Uithof, that was only 4.6 per cent.
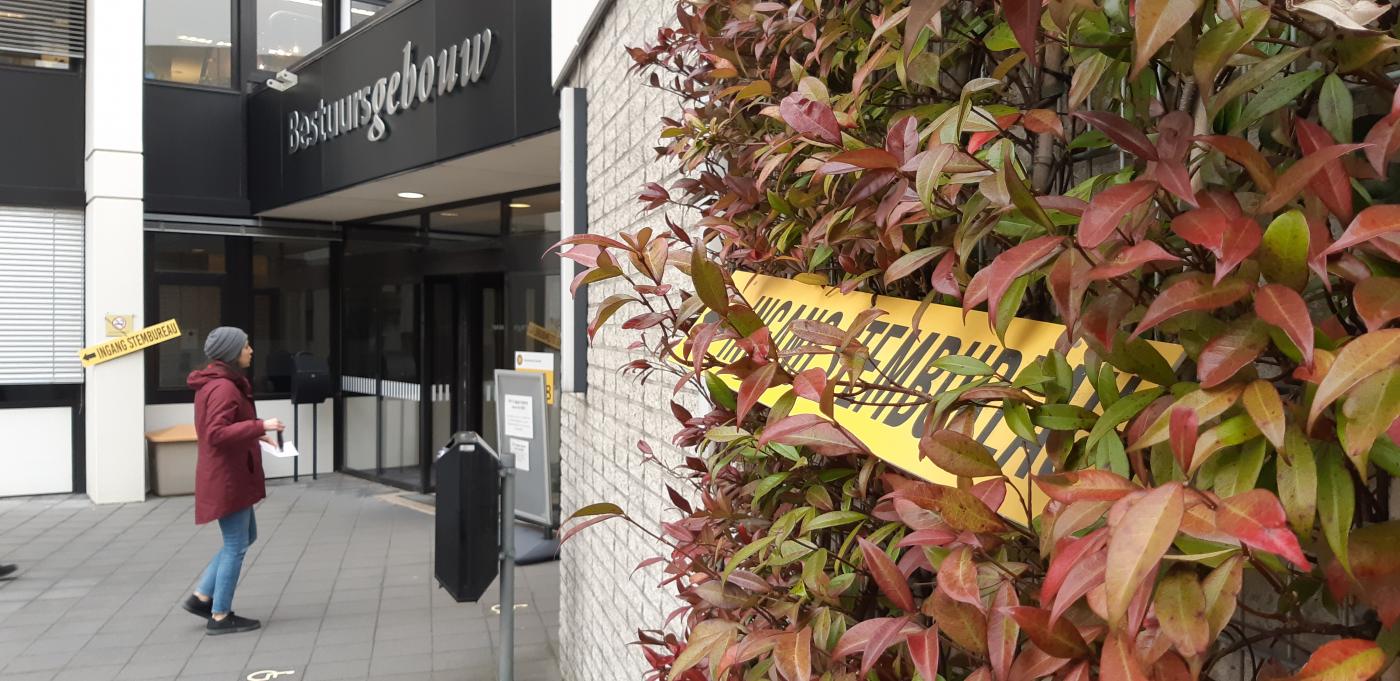
There were two ballots in the Utrecht Science Park this time, one located at the University Medical Centre Utrecht (UMCU), at Heidelberglaan 100, and another one at the Administration Building atHeidelberglaan 6. Although the voting behaviour of the two polling stations is rather similar, there were more left-wing voters at the Administration Building than at the hospital. For example, D66 received 4 per cent less votes at the Administration Building, and VVD 3 per cent less. At the Administration Building, Partij voor de Dieren, Student & Starter and BIJ1 were more popular. Partij voor de Dieren received 5 per cent more votes, Student & Starter 6 per cent and BIJ1 3 per cent more compared to UMCU.
Turnout
In total, 2,094 people voted in the Utrecht Science Park. That is 1.3 percent of all voters in the city. 527 votes were cast at UMCU and 1,567 at the Administration Building. The number of voters has decreased compared to the municipal elections of 2018: 35,4 percent fewer people came to vote. Since fewer classes are being taught on campus and more people are working from home, the turnout was lower than usual.
| Total turnout | |
| Municipal elections 2022 | 2,094 |
| Municipal elections 2018 | 3,243 |