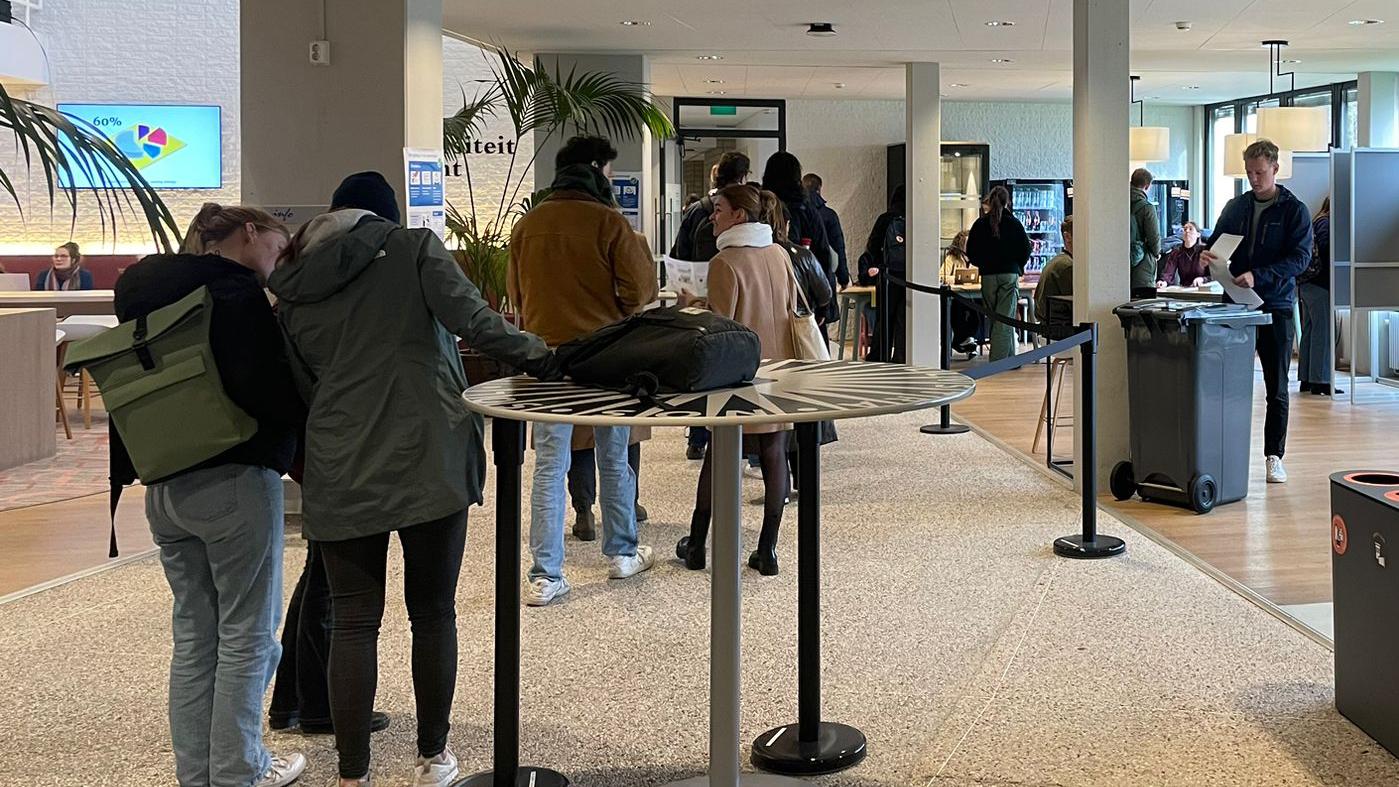
Results from polling stations at the university revealed
UU remains a left-wing stronghold

Four UU buildings served as polling stations on November 22. The most used one was the Administration Building, where 2,058 people cast their votes, followed by the University Medical Centre, with 1,193 votes, and the Dining Hall of University College Utrecht, with 1,023 votes. The Koningsberger building was last, with only 781 votes.
These polling stations were open for anyone who lives in Utrecht, not just those who work or study at the university. Even so, the majority of the people who voted there were indeed affiliated with UU, the University of Applied Sciences, and the University Medical Centre.
Left-wing parties fared even better at these polling stations than elsewhere in the city. With 46.5 percent of the votes, GroenLinks-PvdA obtained roughly 10 percent more votes at the university than in the rest of Utrecht, where the alliance was the preference of 34.9 percent of the voters. Volt also fared better at the university than in the rest of the city (8 percent against 4.6 percent). Parties who received an expressive number of votes nationally, such as PVV, NSC and BBB are not nearly as popular at the university. They obtained 2.8 percent of the votes, 5.6 percent of the voes and 0.9 percent of the votes, respectively.
Here's a comparison of the percentages verified at the polling stations located in UU buildings, the percentages in Utrecht, and the percentages at the national level:
| UU | Utrecht | Landelijk | |
| GL-PvdA | 46.5 | 34.9 | 15.7 |
| D66 | 12.6 | 11.5 | 6.3 |
| Volt | 8 | 4.6 | 1.7 |
| VVD | 7.7 | 11.3 | 15.2 |
| PvdD | 5.8 | 4.4 | 2.2 |
| NSC | 5.6 | 7.1 | 12.9 |
| PVV | 2.8 | 9.9 | 23.6 |
| BIJ1 | 2.4 | 1.2 | 0.4 |
| SP | 1.7 | 2.1 | 3.2 |
| CDA | 1,4 | 1,8 | 3,3 |
| Denk | 1.2 | 5.9 | 2.4 |
| CU | 1.1 | 1.4 | 2 |
| BBB | 0.9 | 1.0 | 4.7 |