Research results available to all
Most students feel like they belong at UU but there is room for improvement

Photo: Pexels
“We’re doing good,” celebrates the Associate Professor of Biomedical Sciences Gönül Dilaver, who supervised the research behind Belonging@UU. “Most students do feel at home here, but one of the most striking results is that we need to support students with disabilities more.”
While students without disabilities rate the extent to which they feel at home at UU with a 4.0, those with disabilities give it a 3.5. Things are a little better when considering only their study programme: in this case, the grade given by students with disabilities rises to a 3.8, compared to the 4.1 given by students without disabilities.
Averages from students with disabilities also tend to be slightly lower when it comes to teachers’ understanding, peer support and how comfortable they feel in the classroom.
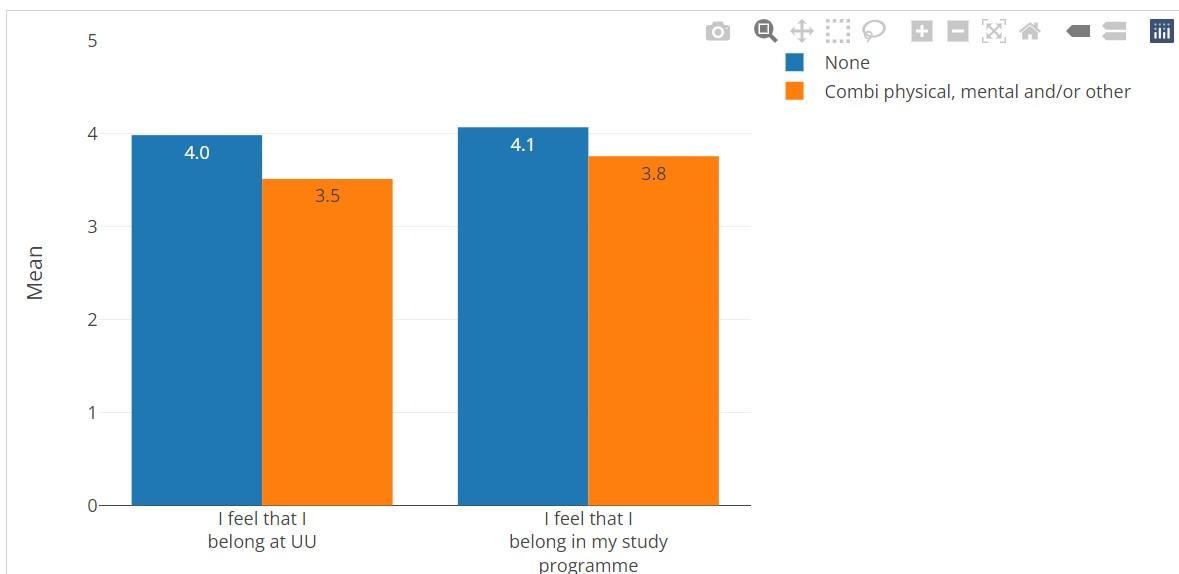
Image: screenshot from the Belonging@UU Dashboard. Students without disabilities are represented in blue, students with disabilities are represented in orange.
Another important takeaway from the survey is that progress could be made in religious students’ sense of belonging. 8.4 percent of the religious students who answered the survey said they experience discrimination at UU. They also feel like they have to debunk stereotypes about their religion and are more likely to feel uncomfortable when interacting with fellow students who differ from them in terms of background, culture, or lifestyle.
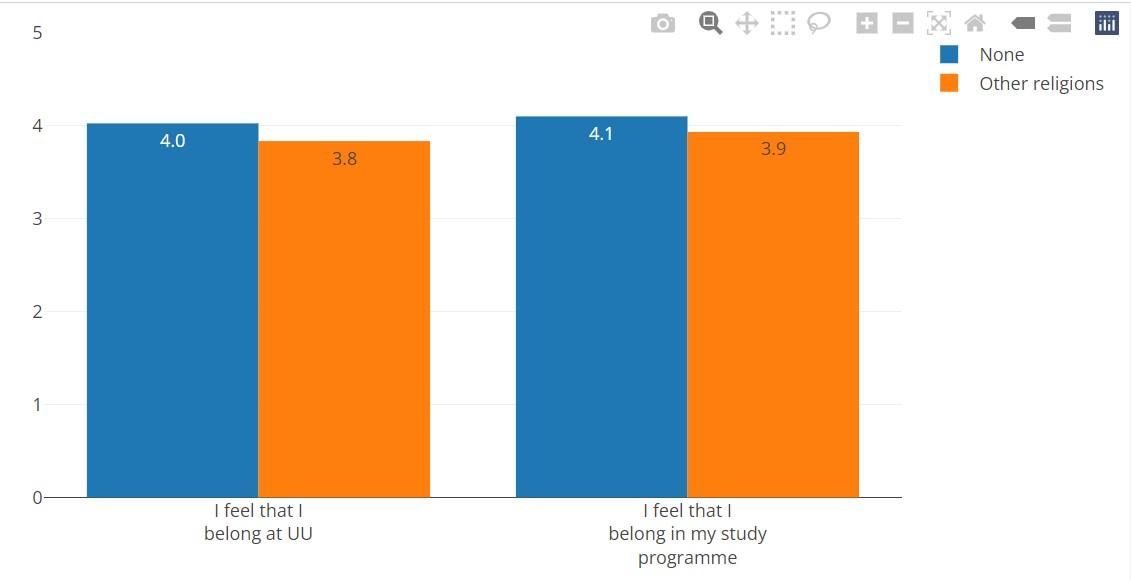
Image: screenshot from the Belonging@UU Dashboard. Non-religious students are represented in blue, religious students are represented in orange.
In addition, the survey shows that male students tend to feel more comfortable in the classroom compared to female students. The same goes for Master’s students, who are more comfortable than their counterparts at the Bachelor’s level. Students with a migration background feel less at home and are more likely to experience discrimination at UU as compared to students with a non-migration background.

Image: screenshot from the Belonging@UU Dashboard. Yellow represents “yes”, pink represents “no”.
Is there something students can do to improve their sense of belonging? The results indicate that joining a student organisation (such as study or student association) can stimulate students’ sense of belonging. It increases from 3.5 to 4.1 when considering the university at large and from 3.7 to 4.2 considering the students’ study programme. “If a student stays at the university after class instead of going home, that’s a good thing. Universities have to make decisions and the Belonging@UU dashboard can perhaps help validate some choices, such as giving money to associations,” says Dilaver.
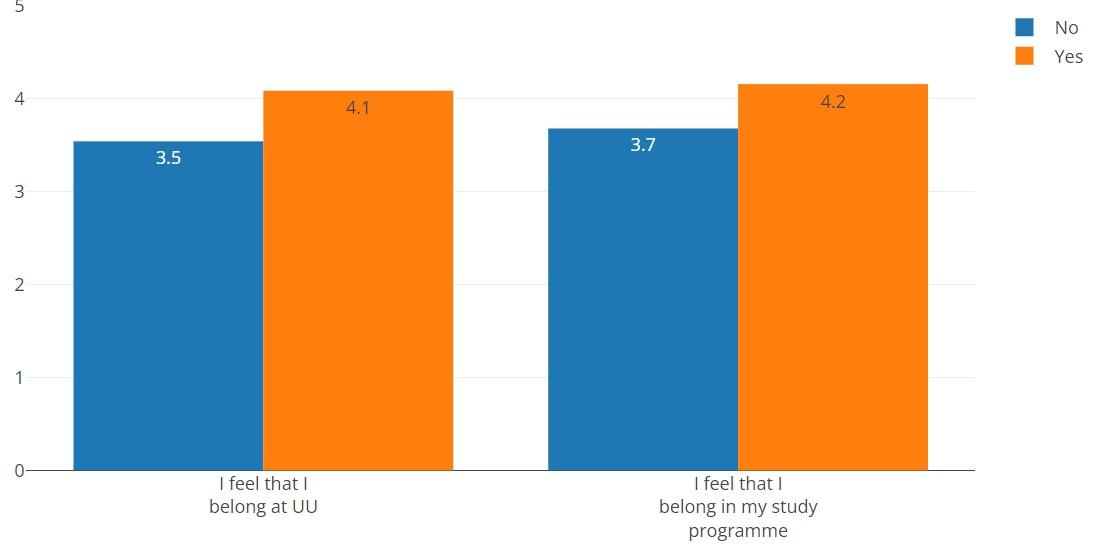
Image: screenshot from the Belonging@UU Dashboard. Blue represents students who are not part of a student organisation, yellow represents those who do.
When a student feels like a fish out of water, this can jeopardise their performance. According to the research, UU’s survey confirms other academic literature that a sense of belonging and authenticity tends to influence study results positively. Hence the importance of using this data to inform university policy. “We all need a sense of belonging. It’s not something we can ignore.”
“Something everyone could have a conversation about”
Belonging@UU is based on a survey of more than 4,400 students (a seemingly representative sample corresponding to 12 percent of UU’s student population). It aimed to answer the following questions: Do UU students experience a sense of belonging at the university? To what extent do they feel like there is room to be themselves in the classroom? Do they feel supported by teachers and peers? And, finally, is there any correlation between their sense of belonging and their study success?
The dashboard, which is available in both English and Dutch, allows users to compare faculties, programmes, and student groups in an easy, straightforward manner.
The survey was conducted last year by Associate Professor Gönül Dilaver, researcher Ulviye Isik, and PhD candidate Anne-Roos Verbree, whose research focuses on the sense of belonging in higher education. They all work at University Medical Centre Utrecht (UMCU). The questionnaire was spread out via e-mail and promoted with the help of student assistants who collected responses on campus.
The three researchers wondered how best to present the results. “Not everyone reads papers. We wanted to have something that everyone at UU could have a conversation about,” explains Dilaver. Hence the dashboard. But that doesn’t mean that an article was ditched altogether. It is currently submitted for publication in a scientific journal.
They took into consideration background characteristics such as gender, sexual orientation, disabilities, whether or not the student comes from abroad, and whether or not they are part of an association. The results were also classified according to faculty, study programme, prior education, and phase of study. Last but not least, respondents were asked to indicate their level of study success, which includes their average grade and study progress in terms of credits.
Dilaver underscores that great attention was paid to the privacy of the respondents. It took them a whole year to sort out all privacy aspects, such as how to ask questions and how to store the data.
Now that the dashboard is up and running, users can easily select the categories they want to compare. But, navigating through it, DUB notices that some comparisons are not available. For example, one can compare faculties, programmes and groups, but it is not possible to compare individual faculties to the whole university. Moreover, data about international students doesn’t specify whether they come from a country within the European Economic Area or not.
Dilaver, Verbree and Isik note that the idea is to keep updating the dashboard: follow-up interviews are currently being conducted and the researchers would like to repeat the survey every two years so that the dashboard is always up to date.